Cloud optimized geoTIFFs: Introduction and usage in rasterio
Cloud optimized geoTIFFs: Introduction and usage in rasterio
Cloud Optimized GeoTIFFs (COGs) are revolutionizing the way we interact with geospatial data in cloud-based workflows. They streamline and expedite access to large data files by leveraging HTTP GET range requests, a method that allows clients to retrieve only the segments of a file that are necessary for their specific task.
Consider the scenario in which you aim to analyze the Normalized Difference Vegetation Index (NDVI) of a local park that spans an area of one square kilometer using Sentinel 2 GeoTIFF imagery. Typically, Sentinel 2 images cover vast regions, requiring extensive downloads for complete image files. In the past, this would mean downloading the full data file (usually exceeding 100MB) for band 4 (red) and another for band 8 (near infrared). But in reality, your analysis only requires a fraction of these data.
This is where the true power of COGs shines. With COGs, you can instruct the server to transmit only specific bytes of an image, leading to significantly more efficient data usage.
The key benefits of COGs include:
- Streamlined access to imagery data
- Reduction of data duplication
- Full compatibility with legacy systems
Operating COGs is as simple as working with standard GeoTIFFs. In the example provided, we will employ an Area of Interest (AOI) defined by a GeoJSON, sat-search to query the latest Sentinel-2 satellite imagery for our specified location, and Rasterio to perform a range request, downloading only the file segments we require. Pyproj will be used for essential coordinate transformations. The cloud-optimized Sentinel 2 imagery is hosted in an AWS S3 repository.
Installation of Required Libraries (Optional: Matplotlib)
pip install rasterio pyproj sat-search matplotlib
Importing Libraries
from satsearch import Search
from datetime import datetime, timedelta
from pyproj import Transformer
from json import load

import rasterio
from rasterio.features import bounds
We commence by opening our GeoJSON file and extracting the geometry. A GeoJSON can be created on geojson.io. To avoid possible errors down the line, it is recommended to create a GeoJSON of moderate size (a 1x1 km² area is ideal).
file_path = "path/to/your/file.geojson"
with open(file_path,"r") as fp:
    file_content = load(fp)
geometry = file_content["features"][0]["geometry"]
In our search, we aim to acquire images not older than 60 days with a cloud cover less than 20%.
# search last 60 days
current_date = datetime.now()
date_60_days_ago = current_date - timedelta(days=60)
current_date = current_date.strftime("%Y-%m-%d")
date_60_days_ago = date_60_days_ago.strftime("%Y-%m-%d")

# only request images with cloudcover less than 20%
query = {
    "eo:cloud_cover": {
        "lt": 20
        }
    }
search = Search(
    url='https://earth-search.aws.element84.com/v0',
    intersects=geometry,
    datetime=date_60_days_ago + "/" + current_date,
    collections=['sentinel-s2-l2a-cogs'],
    query=query
    )
# grep latest red && nir
items = search.items()
latest_data = items.dates()[-1]
red = items[0].asset('red')["href"]
nir = items[0].asset('nir')["href"]
print(f"Latest data found that intersects geometry: {latest_data}")
print(f"Url red band: {red}")
print(f"Url nir band: {nir}")
Having obtained the URLs of the most recent Sentinel 2 imagery for our region, we next calculate the specific pixels required from our GeoTIFF server. Each satellite image measures 10980 x 10980 pixels, with each pixel representing 10 meters of ground resolution. To determine the pixels encompassing our AOI, we must reproject our GeoJSON coordinates into pixel row/column using Rasterio.
Utilizing the capabilities of recent Rasterio versions, we can read COGs by passing a rasterio.windows.Window (which specifies the rows and columns to query) to the read function. To make the query, we must first open a virtual file (URLs of a hosted file).
for geotiff_file in [red, nir]:
    with rasterio.open(geotiff_file) as geo_fp:
Subsequently, we calculate the bounding box around our geometry and employ the pyproj.Transformer to transform our GeoJSON coordinates (EPSG 4326) into Sentinel Sat’s EPSG 32633 projection.
        bbox = bounds(geometry)
        coord_transformer = Transformer.from_crs("epsg:4326", geo_fp.crs)
        # calculate pixels to be streamed in cog
        coord_upper_left = coord_transformer.transform(bbox[3], bbox[0])
        coord_lower_right = coord_transformer.transform(bbox[1], bbox[2])
Having obtained the correct coordinates, we can now compute from coordinates to pixels in our GeoTIFF file using Rasterio.
        pixel_upper_left = geo_fp.index(
            coord_upper_left[0],
            coord_upper_left[1]
            )
        pixel_lower_right = geo_fp.index(
            coord_lower_right[0],
            coord_lower_right[1]
            )

        for pixel in pixel_upper_left + pixel_lower_right:
            # If the pixel value is below 0, that means that
            # the bounds are not inside of our available dataset.
            if pixel < 0:
                print("Provided geometry extends available datafile.")
                print("Provide a smaller area of interest to get a result.")
                exit()
We are now set to perform the desired range request.
        # make http range request only for bytes in window
        window = rasterio.windows.Window.from_slices(
            (
            pixel_upper_left[0],
            pixel_lower_right[0]
            ),
            (
            pixel_upper_left[1],
            pixel_lower_right[1]
            )
        )
        subset = geo_fp.read(1, window=window)
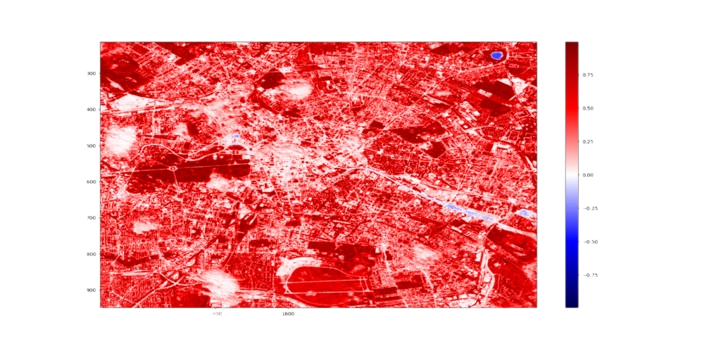
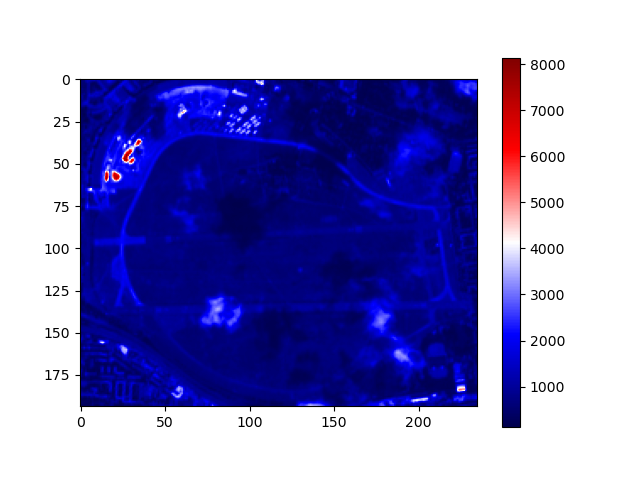
The ‘subset’ object now holds the data we need, which can be accessed and visualized as follows:
        import matplotlib.pyplot as plt
        plt.imshow(subset, cmap="seismic")
        plt.colorbar()
By harnessing the capabilities of COGs, you can now obtain the required GeoTIFF image data in seconds, a significant improvement from the minutes it took previously.
Find the complete code in the attached GitHub link.
from satsearch import Search
from datetime import datetime, timedelta
from pyproj import Transformer
from json import load

import rasterio
from rasterio.features import bounds

file_path = "path/to/your/file.geojson"
with open(file_path,"r") as fp:
    file_content = load(fp)
geometry = file_content["features"][0]["geometry"]

# search last 60 days
current_date = datetime.now()
date_60_days_ago = current_date - timedelta(days=60)
current_date = current_date.strftime("%Y-%m-%d")
date_60_days_ago = date_60_days_ago.strftime("%Y-%m-%d")

# only request images with cloudcover less than 20%
query = {
    "eo:cloud_cover": {
        "lt": 20
        }
    }
search = Search(
    url='https://earth-search.aws.element84.com/v0',
    intersects=geometry,
    datetime=date_60_days_ago + "/" + current_date,
    collections=['sentinel-s2-l2a-cogs'],
    query=query
    )
# grep latest red && nir
items = search.items()
latest_data = items.dates()[-1]
red = items[0].asset('red')["href"]
nir = items[0].asset('nir')["href"]
print(f"Latest data found that intersects geometry: {latest_data}")
print(f"Url red band: {red}")
print(f"Url nir band: {nir}")

for geotiff_file in [red, nir]:
    with rasterio.open(geotiff_file) as geo_fp:
        bbox = bounds(geometry)
        coord_transformer = Transformer.from_crs("epsg:4326", geo_fp.crs)
        # calculate pixels to be streamed in cog
        coord_upper_left = coord_transformer.transform(bbox[3], bbox[0])
        coord_lower_right = coord_transformer.transform(bbox[1], bbox[2])
        pixel_upper_left = geo_fp.index(
            coord_upper_left[0],
            coord_upper_left[1]
            )
        pixel_lower_right = geo_fp.index(
            coord_lower_right[0],
            coord_lower_right[1]
            )

        for pixel in pixel_upper_left + pixel_lower_right:
            # If the pixel value is below 0, that means that
            # the bounds are not inside of our available dataset.
            if pixel < 0:
                print("Provided geometry extends available datafile.")
                print("Provide a smaller area of interest to get a result.")
                exit()

        # make http range request only for bytes in window
        window = rasterio.windows.Window.from_slices(
            (
            pixel_upper_left[0],
            pixel_lower_right[0]
            ),
            (
            pixel_upper_left[1],
            pixel_lower_right[1]
            )
        )
        subset = geo_fp.read(1, window=window)

        # vizualize
        import matplotlib.pyplot as plt
        plt.imshow(subset, cmap="seismic")
        plt.colorbar()
        plt.show()