Cloud optimized geoTIFFs: Introduction and usage in rasterio
Cloud optimized geoTIFFs: Introduction and usage in rasterio
Cloud Optimized GeoTIFFs (COGs) let you download only the bytes you need from a large satellite image, using HTTP GET range requests. Instead of pulling the full file, you request the specific pixel ranges relevant to your area of interest.
Example: you want to compute the NDVI of a 1 km² park using Sentinel-2 imagery. Each Sentinel-2 band file exceeds 100MB. Without COGs, you download the full file for band 4 (red) and band 8 (NIR). With COGs, you download a fraction of each.
COGs are backward-compatible with standard GeoTIFFs. Below, we use a GeoJSON AOI, sat-search to query Sentinel-2 imagery, Rasterio for the range request, and Pyproj for coordinate transforms. The Sentinel-2 COGs are hosted on AWS S3.
Installation of Required Libraries (Optional: Matplotlib)
pip install rasterio pyproj sat-search matplotlib
Importing Libraries
from satsearch import Search
from datetime import datetime, timedelta
from pyproj import Transformer
from json import load

import rasterio
from rasterio.features import bounds
Open the GeoJSON and extract the geometry. Create one at geojson.io, keeping the area small (1x1 km² works well).
file_path = "path/to/your/file.geojson"
with open(file_path,"r") as fp:
    file_content = load(fp)
geometry = file_content["features"][0]["geometry"]
Search for images from the last 60 days with less than 20% cloud cover.
# search last 60 days
current_date = datetime.now()
date_60_days_ago = current_date - timedelta(days=60)
current_date = current_date.strftime("%Y-%m-%d")
date_60_days_ago = date_60_days_ago.strftime("%Y-%m-%d")

# only request images with cloudcover less than 20%
query = {
    "eo:cloud_cover": {
        "lt": 20
        }
    }
search = Search(
    url='https://earth-search.aws.element84.com/v0',
    intersects=geometry,
    datetime=date_60_days_ago + "/" + current_date,
    collections=['sentinel-s2-l2a-cogs'],
    query=query
    )
# grep latest red && nir
items = search.items()
latest_data = items.dates()[-1]
red = items[0].asset('red')["href"]
nir = items[0].asset('nir')["href"]
print(f"Latest data found that intersects geometry: {latest_data}")
print(f"Url red band: {red}")
print(f"Url nir band: {nir}")
Now we need to convert our AOI coordinates into pixel row/column. Each Sentinel-2 image is 10980 x 10980 pixels at 10m resolution. Rasterio can read COGs by passing a rasterio.windows.Window to the read function. Open the remote file as a virtual file:
for geotiff_file in [red, nir]:
    with rasterio.open(geotiff_file) as geo_fp:
Compute the bounding box and transform from EPSG 4326 to the Sentinel projection.
        bbox = bounds(geometry)
        coord_transformer = Transformer.from_crs("epsg:4326", geo_fp.crs)
        # calculate pixels to be streamed in cog
        coord_upper_left = coord_transformer.transform(bbox[3], bbox[0])
        coord_lower_right = coord_transformer.transform(bbox[1], bbox[2])
Convert coordinates to pixel indices:
        pixel_upper_left = geo_fp.index(
            coord_upper_left[0],
            coord_upper_left[1]
            )
        pixel_lower_right = geo_fp.index(
            coord_lower_right[0],
            coord_lower_right[1]
            )

        for pixel in pixel_upper_left + pixel_lower_right:
            # If the pixel value is below 0, that means that
            # the bounds are not inside of our available dataset.
            if pixel < 0:
                print("Provided geometry extends available datafile.")
                print("Provide a smaller area of interest to get a result.")
                exit()
Now the range request:
        # make http range request only for bytes in window
        window = rasterio.windows.Window.from_slices(
            (
            pixel_upper_left[0],
            pixel_lower_right[0]
            ),
            (
            pixel_upper_left[1],
            pixel_lower_right[1]
            )
        )
        subset = geo_fp.read(1, window=window)
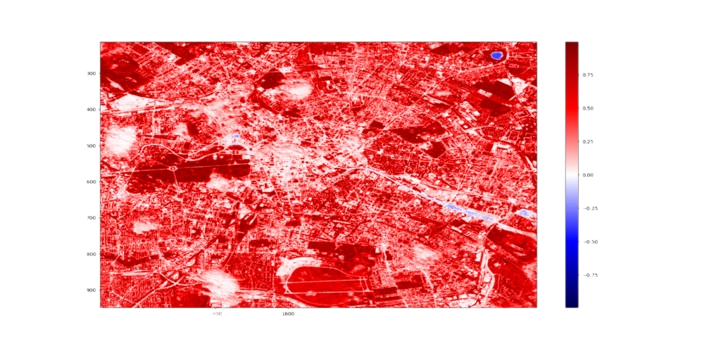
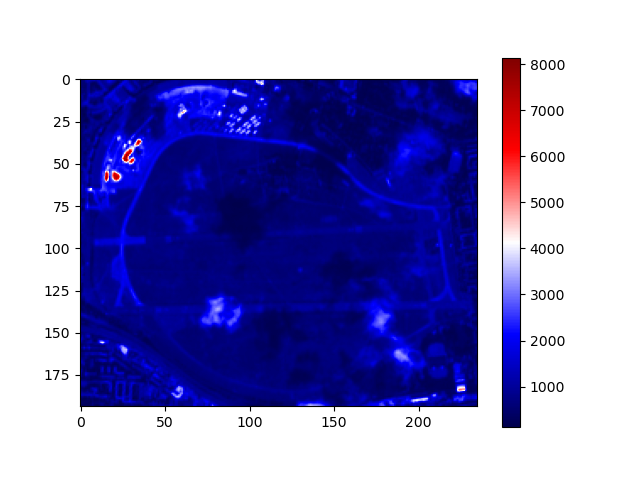
Visualize the result:
        import matplotlib.pyplot as plt
        plt.imshow(subset, cmap="seismic")
        plt.colorbar()
What took minutes now takes seconds. Full code below.
from satsearch import Search
from datetime import datetime, timedelta
from pyproj import Transformer
from json import load
import rasterio
from rasterio.features import bounds
file_path = "path/to/your/file.geojson"
with open(file_path,"r") as fp:
file_content = load(fp)
geometry = file_content["features"][0]["geometry"]
# search last 60 days
current_date = datetime.now()
date_60_days_ago = current_date - timedelta(days=60)
current_date = current_date.strftime("%Y-%m-%d")
date_60_days_ago = date_60_days_ago.strftime("%Y-%m-%d")
# only request images with cloudcover less than 20%
query = {
"eo:cloud_cover": {
"lt": 20
}
}
search = Search(
url='https://earth-search.aws.element84.com/v0',
intersects=geometry,
datetime=date_60_days_ago + "/" + current_date,
collections=['sentinel-s2-l2a-cogs'],
query=query
)
# grep latest red && nir
items = search.items()
latest_data = items.dates()[-1]
red = items[0].asset('red')["href"]
nir = items[0].asset('nir')["href"]
print(f"Latest data found that intersects geometry: {latest_data}")
print(f"Url red band: {red}")
print(f"Url nir band: {nir}")
for geotiff_file in [red, nir]:
with rasterio.open(geotiff_file) as geo_fp:
bbox = bounds(geometry)
coord_transformer = Transformer.from_crs("epsg:4326", geo_fp.crs)
# calculate pixels to be streamed in cog
coord_upper_left = coord_transformer.transform(bbox[3], bbox[0])
coord_lower_right = coord_transformer.transform(bbox[1], bbox[2])
pixel_upper_left = geo_fp.index(
coord_upper_left[0],
coord_upper_left[1]
)
pixel_lower_right = geo_fp.index(
coord_lower_right[0],
coord_lower_right[1]
)
for pixel in pixel_upper_left + pixel_lower_right:
# If the pixel value is below 0, that means that
# the bounds are not inside of our available dataset.
if pixel < 0:
print("Provided geometry extends available datafile.")
print("Provide a smaller area of interest to get a result.")
exit()
# make http range request only for bytes in window
window = rasterio.windows.Window.from_slices(
(
pixel_upper_left[0],
pixel_lower_right[0]
),
(
pixel_upper_left[1],
pixel_lower_right[1]
)
)
subset = geo_fp.read(1, window=window)
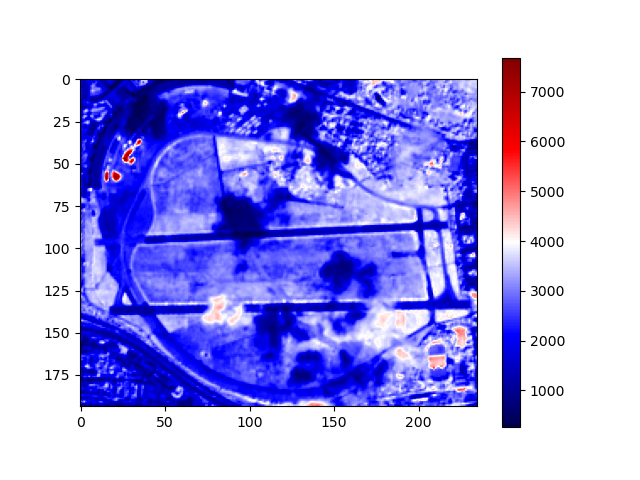
# vizualize
import matplotlib.pyplot as plt
plt.imshow(subset, cmap="seismic")
plt.colorbar()
plt.show()