Hyperlocal Weather Forecasting Makes the Difference
Making the Most of Hyper-local Weather Forecasting
Today it’s 50% precipitation probability. Cool, thanks for nothing!
Understanding the concept of a “50% precipitation probability” can be a bit perplexing. It raises questions such as: Does it imply that it will rain 50% of the time, or does it refer to the likelihood of experiencing any rainfall? Why is there a probability for precipitation but none for sunshine or wind?
Weather parameters are distinguished by their spatial extent, implying that while it might be raining just a hundred meters away, you may still remain dry. Similarly, it is highly improbable that the temperature is 5° higher just a hundred meters from your location.
The most reliable government numerical weather models forecast weather on a 2km x 2km grid. However, a precipitation field, or its edges, could be significantly smaller. Therefore, a precipitation probability is necessary as it indicates the likelihood of experiencing rainfall within a given 2km x 2km grid.
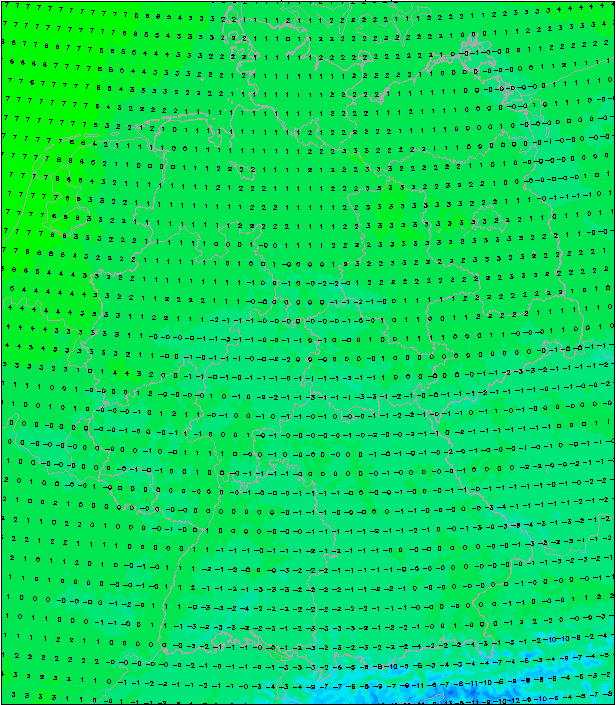 Germany’s COSMO (2km x 2km) forecast. Even at this resolution, the alpine passes in the south are faintly visible.
Enhancing Accuracy with High-Resolution Probability Scores
It’s clear that higher spatial resolutions can improve the accuracy of probability scores. By subdividing a 2km x 2km grid into four smaller grids, it’s possible to identify the grid with an 80% likelihood of rain, while the probability in other grids could decrease to 40%. This approach retains the overall 50% probability for the larger 2km x 2km grid. This information can significantly lower operating costs and boost efficiency for smart city traffic systems, insurance companies, and rescue services.
Small-scale variations are not only crucial for precipitation forecasts but also for predicting solar radiation (coverage), wind, and in some cases, temperature. The following illustration demonstrates a temperature gradient for a single location (Mainz, Germany) at different times. The temperature varies with altitude as shown on the x-axis. Depending on the current weather situation, an altitude difference of just 50 meters can determine whether an area will experience sub-zero temperatures or not. This small variation could decide which roads might freeze and which ones won’t.
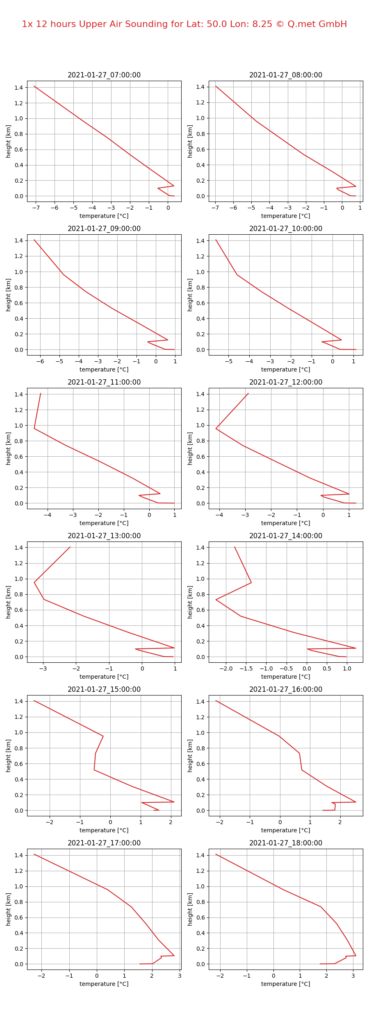 © Q.met GmbH
The major limitation for high-resolution weather models is the availability of observation data. For instance, the metropolitan area of Berlin, covering more than 880 km², only hosts five meteorological weather stations. That’s approximately one station per 180km².
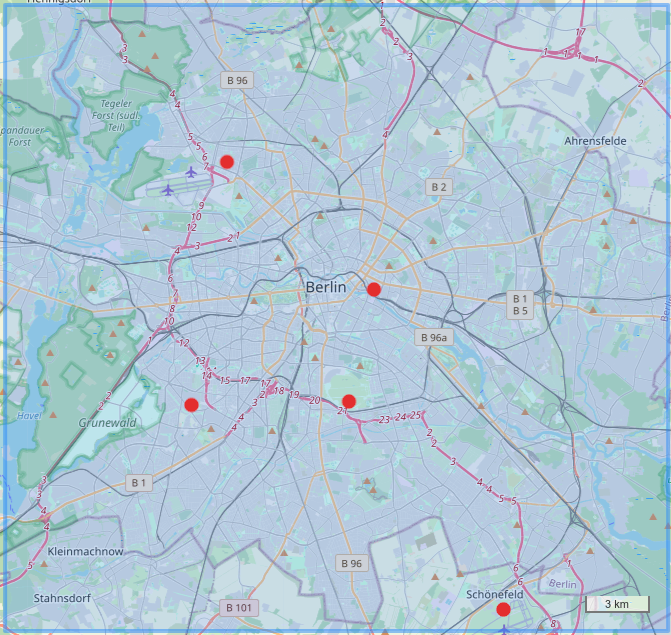
Traditional meteorological weather stations need to adhere to standard practices regarding their setup and operation, enabling data comparability without necessitating data cleansing. With increasing observational data, machine learning algorithms are being trained to identify anomalies and misconfigured sensors. In response to this, we are developing new technologies to glean observation data from existing infrastructure, including vehicle sensors, smart home devices, and even mobile backhauls. This will increase the number of observational sources in Berlin from 5 to over 1000.
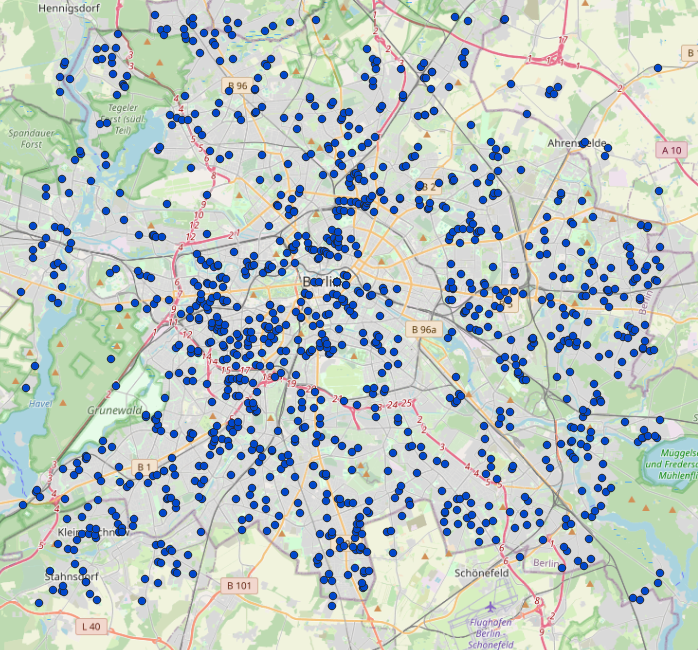
Leveraging IoT Infrastructure to Gather Observational Data
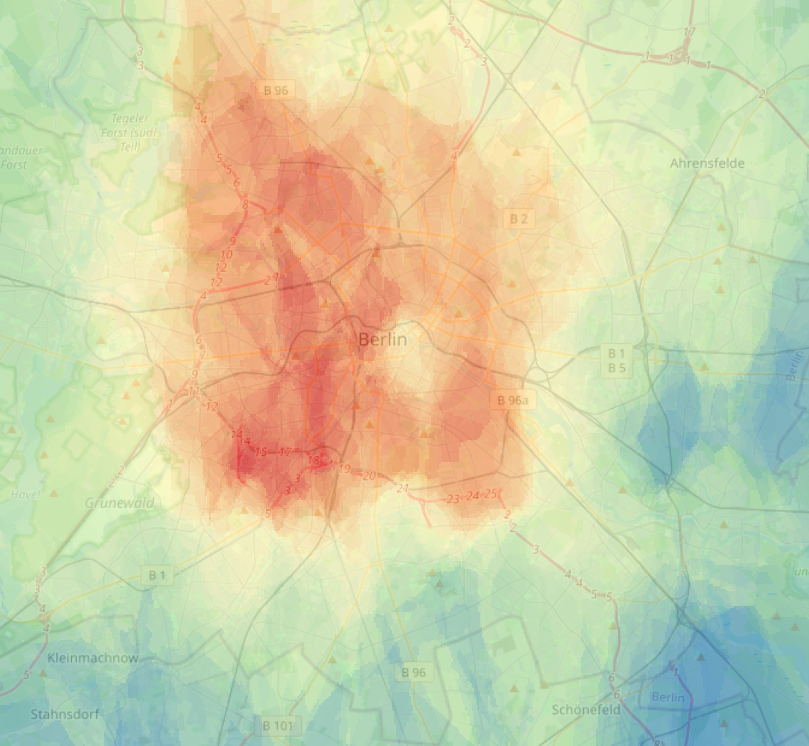
It’s evident that high-resolution weather data will be an essential resource for emerging networked technologies, such as autonomous vehicles and delivery drones. Moreover, it will promote efficiency gains in areas like energy management, predictive maintenance, demand forecasting, and data-driven insurance premiums. In addition, these innovative technologies will enhance the accuracy of weather models by supplying real-time observational data.
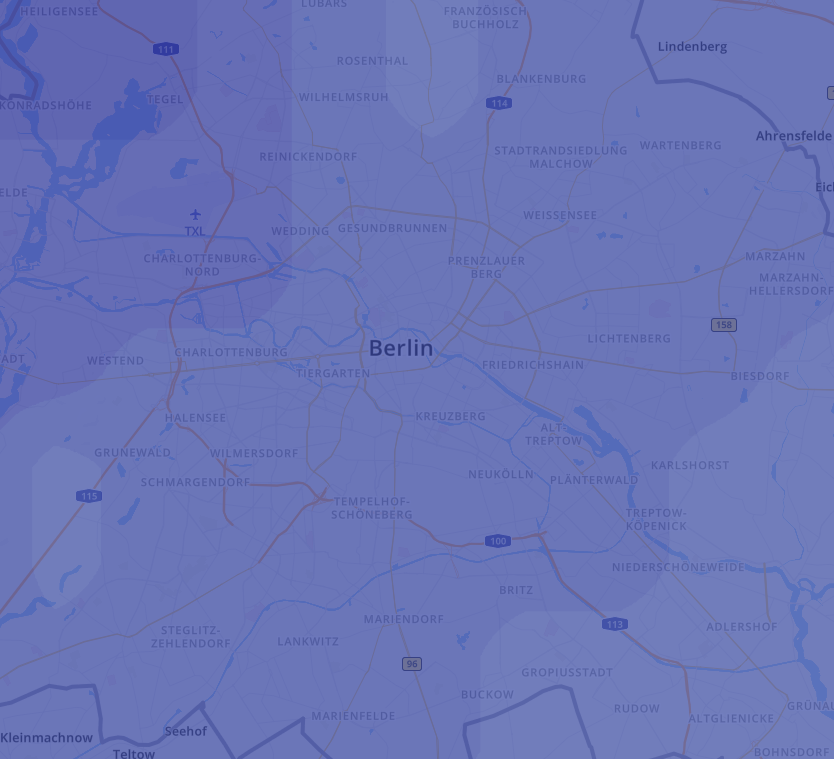
Displayed above is a forecast map I generated using data from the aforementioned 1000+ IoT sensors. Below it, you can see a 2-km resolution numerical weather forecast from weather.com, which uses traditional weather observations. Different colors represent different temperatures. Can you identify the differences?