Hyperlocal Weather Forecasting Makes the Difference
Making the Most of Hyper-local Weather Forecasting
Today it’s 50% precipitation probability. Cool, thanks for nothing!
What does “50% precipitation probability” actually mean? That it will rain 50% of the time? That there’s a 50% chance of any rainfall at all?
The answer has to do with resolution. Weather parameters vary over small distances. It might be raining a hundred meters away while you stay dry. Temperature, on the other hand, won’t differ by 5° over the same distance.
The best government numerical weather models forecast on a 2km x 2km grid. But a precipitation field, or its edges, can be much smaller than 2km. The probability reflects the likelihood of rainfall somewhere within that grid cell.
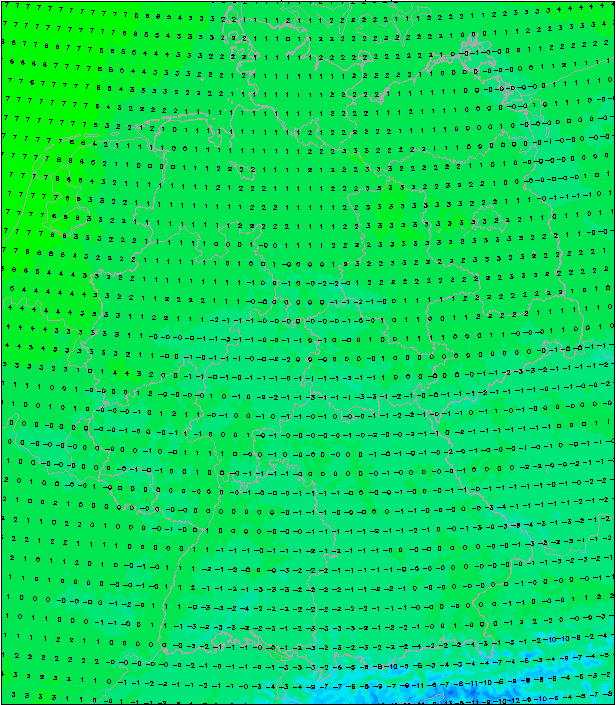 Germany’s COSMO (2km x 2km) forecast. Even at this resolution, the alpine passes in the south are faintly visible.
Higher resolution, better probabilities
Subdivide a 2km x 2km grid into four smaller grids and you can identify which one has an 80% likelihood of rain while the others drop to 40%. The overall 50% probability for the larger grid is preserved, but now you have actionable information for traffic systems, insurance, and rescue services.
Small-scale variations matter for more than precipitation. Solar radiation, wind, and sometimes temperature all vary at sub-grid scales. The illustration below shows a temperature gradient for Mainz, Germany at different times. Temperature changes with altitude (x-axis). An altitude difference of 50 meters can determine whether a road freezes or not.
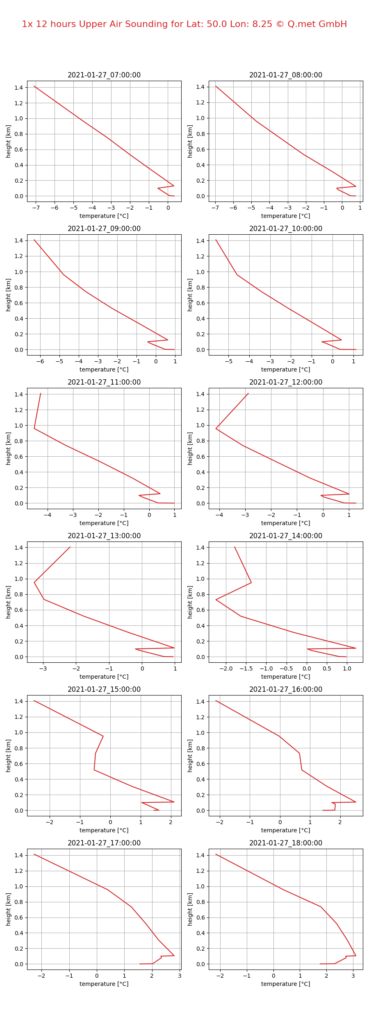 © Q.met GmbH
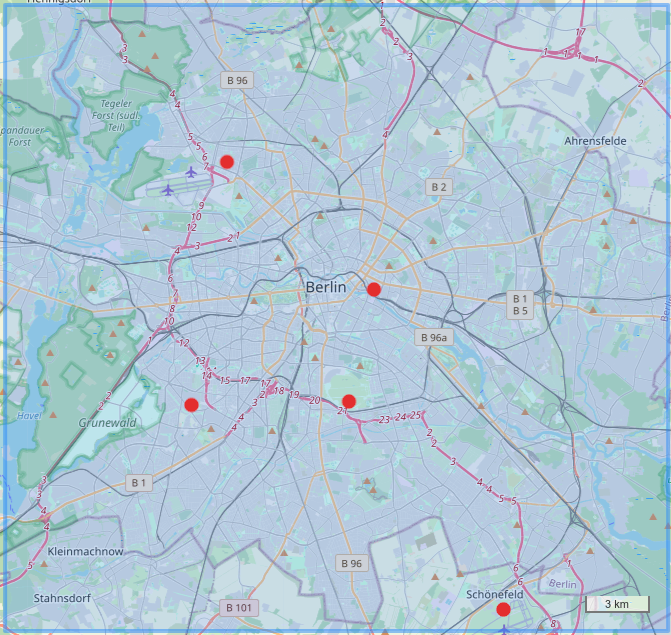
The major limitation for high-resolution weather models is the availability of observation data. For instance, the metropolitan area of Berlin, covering more than 880 km², only hosts five meteorological weather stations. That’s approximately one station per 180km².
Traditional weather stations follow strict setup and operation standards so their data is comparable without cleansing. But you can also pull observation data from existing infrastructure: vehicle sensors, smart home devices, mobile backhauls. With machine learning to identify anomalies and misconfigured sensors, these sources become usable. We increased the number of observational sources in Berlin from 5 to over 1000.
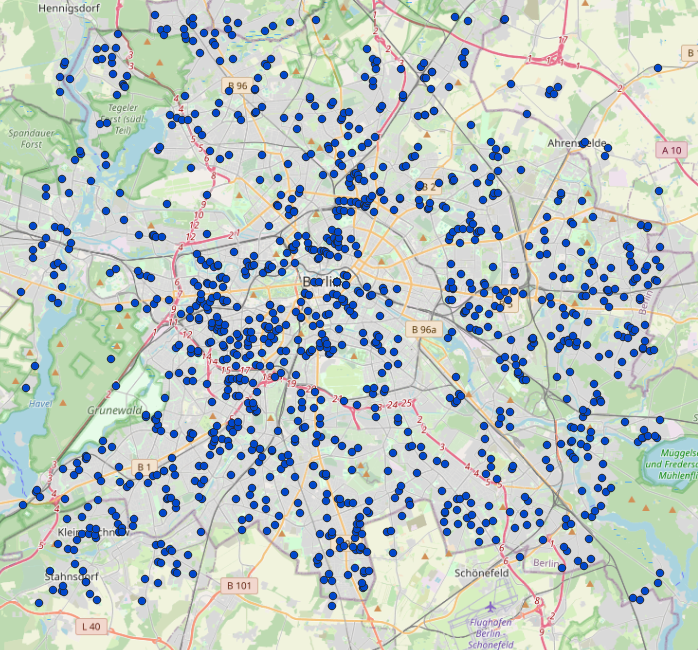
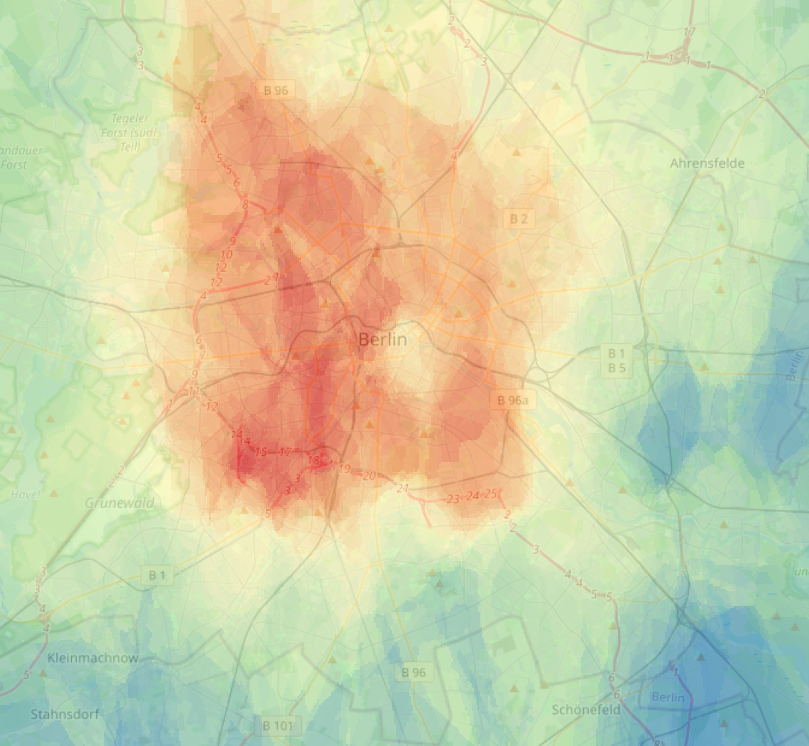
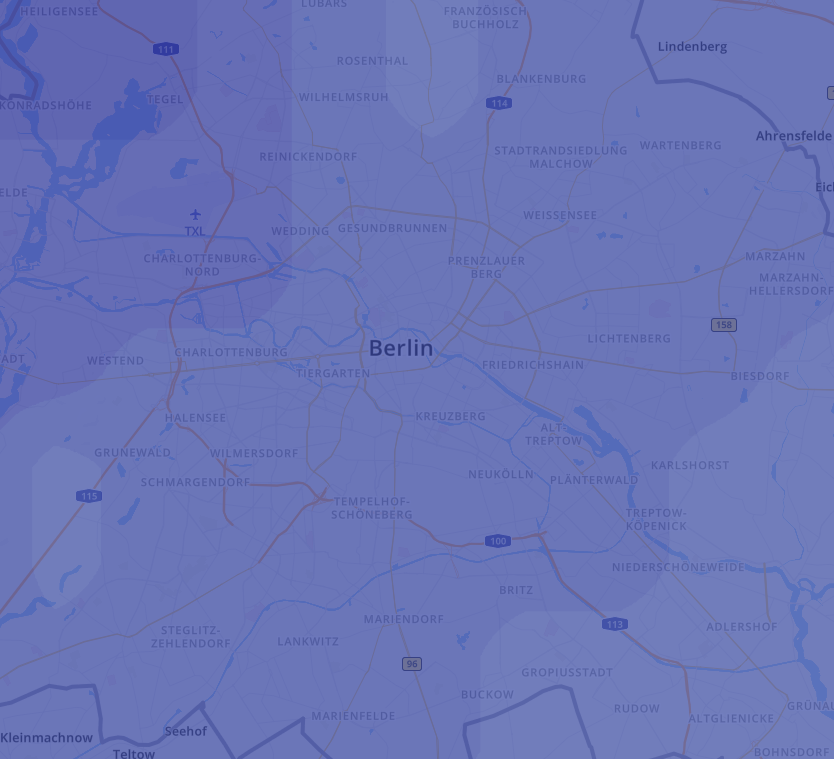
The results
Above is a forecast map I generated using data from those 1000+ IoT sensors. Below it, a 2km resolution numerical weather forecast from weather.com based on traditional observations. Different colors represent different temperatures.